


From replacing heaters in the dead of winter to tuning up AC units during the summer, HVAC businesses seemingly always have something to do. But how significantly do changes in local weather impact the number of HVAC service calls in your area? In this sweltering July heat, that’s a burning question. And we’ve got the answer! Based on research into several HVAC companies’ inbound call totals and temperatures in the country throughout 2020, it seems that there is a direct correlation between HVAC call volume and local weather. From requesting annual system maintenance to repairs to installing an entirely new unit, customers are dialing in. We’ve analyzed data from four of our HVAC customers so that you can see how weather trends dictate call volume. With an answering service on their side, these businesses never missed a call when Mother Nature sent her worst!
Customer 1: Myrtle Beach, SC
The Humid Subtropical climate of Coastal South Carolina is warm year-round, with relatively mild winters and hot summers, making it an enormously popular retirement destination.
During winter months, the average daytime high is in the mid 50s, and lows seldom hit the freezing point, hovering closer to 40 degrees. Whether homes utilize heat pumps or furnaces to take the chill out of the air, most systems are easily able to respond to the cooler temps and may not require a significant amount of maintenance, unless parts fail. So, for Client A, the real action happens once the thermometer cracks 70 and humidity creeps in.
Usage Breakdown
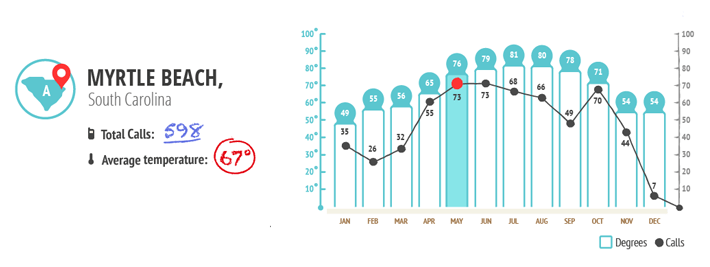
Client A’s data revealed that an uneventful winter did not bring an abundance of service calls – an average of only 31 calls per month. The numbers began to change in April, with a 72% increase in call volume just as the mid-range temp neared 70 degrees.

May heated things up, with another 33% bump in usage to 73 calls per month. Extended data showed that June had 28 days with the high hitting above the 80-degree mark, and it just kept getting hotter. July saw highs in the 80s and 90s for the entire month. Talk about sticky! And August came close, with only one day below 80. Remaining somewhat steady through the summer swelter, inbound volume averaged 70 per month through August. As the daily high became more bearable, usage took a dive, but with a notable spike in October – possibly from customers trying to get a jump on annual maintenance before night time temperatures dipped into the 40s and that extra blanket just wouldn’t do. With the cold addressed, December calls plummeted 84% to 7.
Customer 2: Minneapolis, MN
Sitting about 150 miles southwest of Lake Superior, Minneapolis’ climate is characterized as Hot-Summer Humid Continental, with bitter cold, snowy winters, and steamy summers, when the humidity nears 100%.
In the coldest months of the year, the Twin Cities’ average high is in the mid to upper 20s, and normal seasonal snowfall is around 47 inches. When the heat rolls in, temperatures reach into the low 80s and are accompanied by a considerable amount of rain, making the air at best humid, and more often muggy or downright oppressive. January 2020 produced daytime temperatures under 15 degrees for just about half of the days, and ten nights where the thermometer fell below zero, dipping down to as low as -28 degrees towards the end of the month.
Usage Breakdown
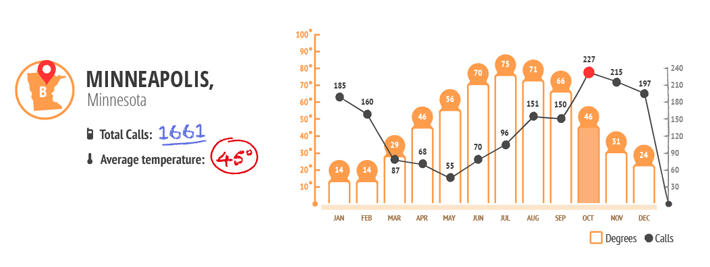
With an mid-range of 14 degrees for both January and February, Client B started off 2020 with a bang – 185 and 160 calls per month, respectively. Extended data shows that February was record breaking, during which the city was on the receiving end of 39 inches of snow! As the air became twice as warm (although still super cold…), call volume tanked by 46%.
Temps climbed into the 50s in May, giving HVAC systems a break, and dropping usage to a low of 55 calls. Adding 14 degrees to the summer thermometer, June saw a 27% increase in volume, and another few degrees later, July totals were up by 37%. August highs cracked 80 for about a third of the month, and that was enough to boost usage by 57%. A big upswing in October to 227 calls per month proved that no one wanted their heat to be on the fritz for the impending winter. October, November and December totals accounted for just over 38% of the year’s call volume.
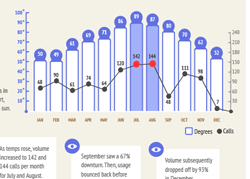
Customer 3: Tucson, AZ
On the eastern border of the Sonoran Desert, Tucson is classified as a Mid-Latitude Steppe and Desert climate, with dry, hot summers, warm winters, and a few months of rain to quench the landscape.
Topping 100 degrees in May through September, and sometimes into October, and managing the incredible humidity and flash flooding of the monsoon season, Tucson’s weather is typical of the Arizona desert. The sun is blazing. On the hottest days, even the best canopy is no match for its unrelenting heat. What the area lacks in comfortability in summer is easily made up for in winter, with a good half of the year experiencing highs between 65 and 80 degrees.
Usage Breakdown
Client C’s call volume was a steady presence in the first few months of the year, before the desert started to really heat up. The initial spike fell between May and June, when usage nearly doubled from 64 calls per month to 120 calls per month – an 88% burst.
It comes as no great surprise that the onset of monsoon season, when the desert turns into a sauna, brought another swell of calls, increasing to 142 and 144 calls per month for July and August, respectively. Extended data shows that though the highest recorded humidity in August was 100%, the August mid-range humidity was only 43% – 9 points lower than the September mid-range of 52%. Looks like summer customers got ahead of the thicker air, explaining the significant 67% downturn in September. As temperatures went south and nighttime lows dipped from the 60s to the 40s, calls bounced back in preparation for cooler temps before finally dropping off by 93% in December.
Bring on the Monsoons!
Arizona’s summer months bring the monsoon season, starting in June and lasting until September, with dramatic thunderstorms, amazing lightning strikes, heavy rain, and flash flooding.
Customer 4: Houston, TX
With a 2020 annual rainfall total of just shy of 52 inches, Houston lives up to its climate, Humid Subtropical. Residents experience hot, humid summers and mild winters. And the city is no stranger to heavy-hitting hurricanes and the occasional tornado.
Houston’s humidity averages 72% throughout the year, with highs coming entirely too close to, or hitting, 100%. That makes for seriously uncomfortable air. As if that isn’t bad enough, usual temperatures reach into the 80s and 90s for six months out of the year, May through October – an unfriendly pairing with tropical humidity. While winter doesn’t often visit with snow in tow, it is known for creating dangerous ice storms that city folk are ill-equipped to handle, as balmy days and nights are much more the norm.
Usage Breakdown
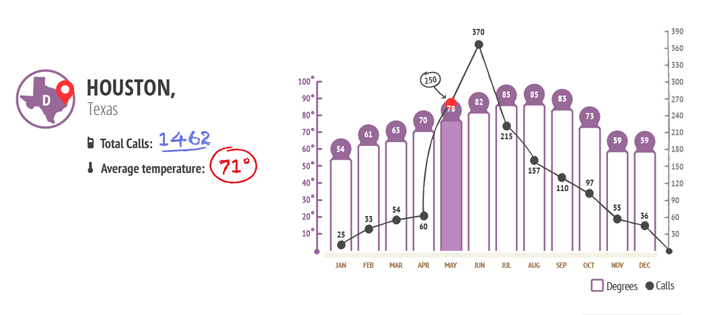

January through April were relatively slow months for Client D, especially when compared to May through August. The May daytime thermometer fluxed between 82 and 91 degrees for almost the entire month, with only three days bringing temperatures below the 80-degree mark. And, as a result, we see the tremendous swing in volume, which skyrocketed from 60 calls in April to 250 calls in May – a whopping 317% increase!
The deluge continued in June, topping out at 370 calls for a 48% upshoot. Though the temperatures went up, July and August usage slowed, totaling only two more calls combined – 372 – than June’s number alone.
Despite a recorded high of 98 degrees in September and 93 degrees in October, the mid-range temperature cooled from the 80s to the 70s. Call volume decreased by about 50% in the September and October total but still brought in a respectable amount before trailing off to finish out the year.
